An AI agent can fail without raising a single error. It reads weak context, picks the wrong tool, gets a clean response from that tool, and returns an answer that is confident, fluent and wrong. No exception is thrown and no alert fires. The dashboard stays green.
Observability practice was built for software that breaks loudly. Agents break that assumption. This piece covers why their failures stay hidden, which signals expose them, how teams turn a vague symptom into a root cause, and where today's tooling stops. For how tracing fits beside retrieval, evals, caching and guardrails, see our guide to production GenAI systems.
The short version
- A wrong answer can start in four places: the agent's reasoning, a tool, the context it was given, or the infrastructure underneath. From the outside they look the same.
- Small silent errors compound. Across a ten-step pipeline, steps that each work 95% of the time leave about four in ten requests touched by at least one quiet slip.
- Metrics, traces and logs answer different questions. Metrics say that something is wrong, traces say where, and logs say why.
- Signals come from three layers: the application, the agent framework and the runtime. Each one alone leaves blind spots.
- Evals run in three modes: offline before shipping, online over live traces, and ad hoc when something looks off.
- Standards are arriving but immature. OpenTelemetry's GenAI conventions are still in development, and cost, quality and agent-aware alerting remain weak spots across the industry.
- Observability records what happened. It does not prove it. A trace cannot show that it was never altered, or which input actually caused an action. Those are the next problems.
Monitoring and observability
Monitoring answers questions you thought to ask in advance. It watches predefined thresholds such as CPU, error rate, latency and queue length, and fires alerts when they are crossed.
Observability is the ability to ask new questions after something unexpected happens, using the data the system already emits. It matters most when you cannot list the failure modes ahead of time, which is the normal situation with agents.
Ordinary software is deterministic: the same input produces the same output, and a failure usually leaves a stack trace. An agent is different. The same request can take a different reasoning path, call different tools and reach a different conclusion on each run. From outside, only the input and the final output are visible. The plan, the tool calls and the intermediate steps stay invisible unless someone instruments them.
One wrong answer, four possible origins
When an agent gives a wrong answer, it looks like a single failure. It can have started in at least four different places.
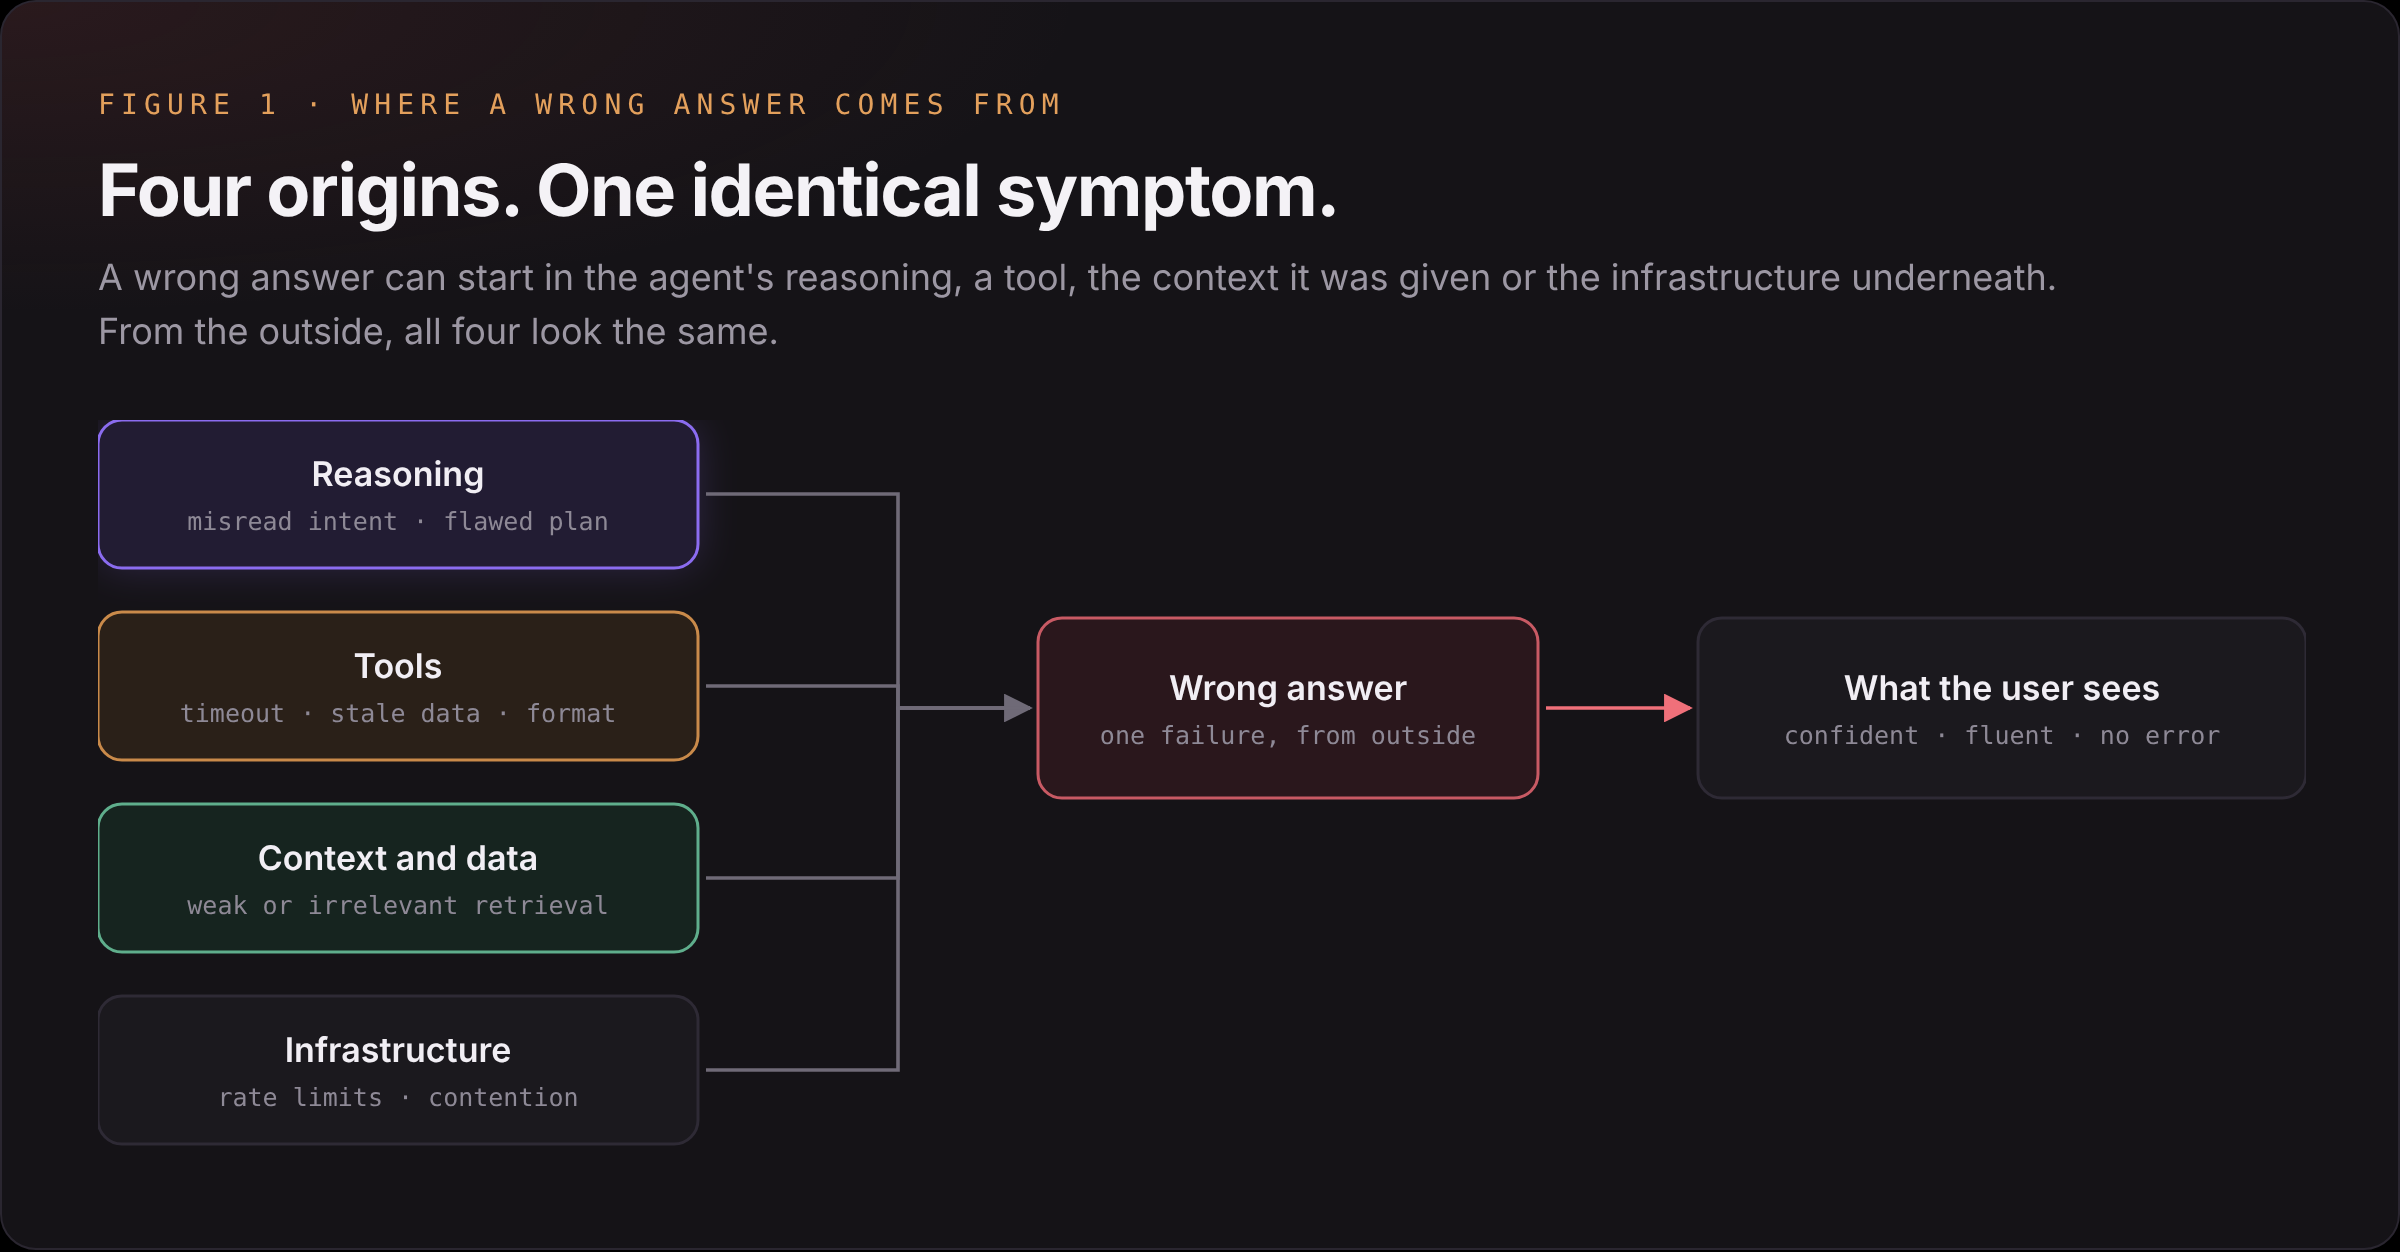
- Reasoning. The agent misreads the request, builds a flawed plan or invents a fact.
- Tools. A call times out, returns stale data, or comes back in a format the agent misinterprets.
- Context and data. Retrieval returns weak or irrelevant passages, and the agent works from them.
- Infrastructure. Rate limits, slow disks or resource contention cause truncated responses, retries or fallbacks.
The fix is different in each case. Without a record of the path the request took, a team is left guessing which one it was.
How silent failures compound
Take a request for the cheapest flight to a city. Retrieval returns weak context, but nothing flags it as an error, because "weak" is not a threshold anyone set. The agent accepts it. Working from that context, it calls the wrong tool. The tool processes the call normally. Every component reports success, and the user gets a confident answer that is wrong.
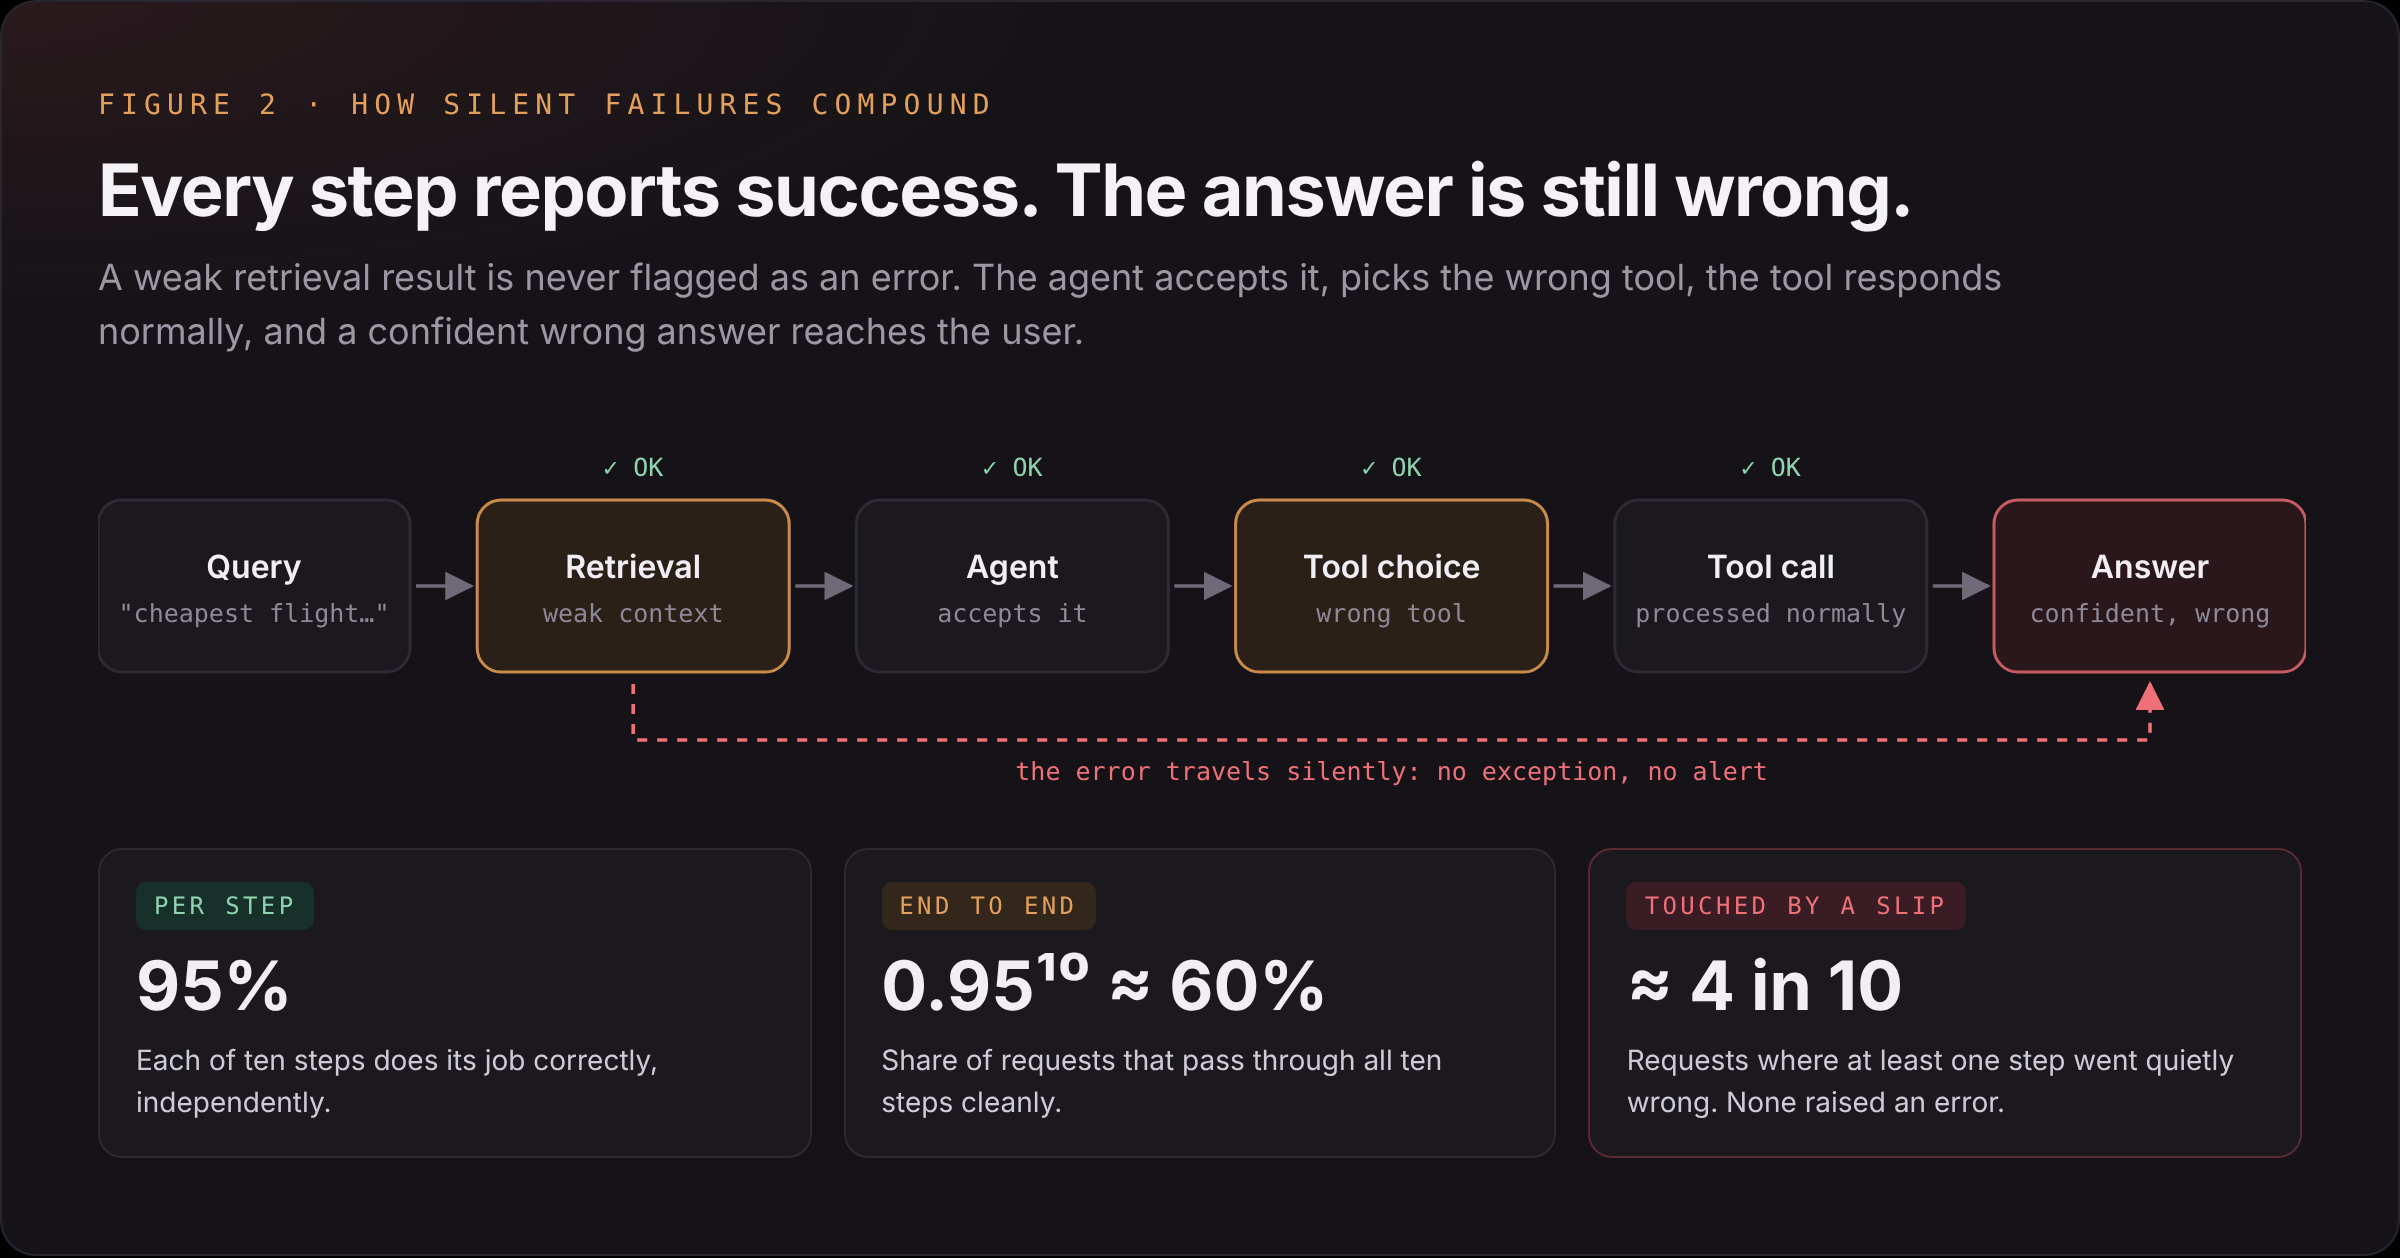
The arithmetic makes the stakes clear. Suppose an agent pipeline has ten steps, and each does its job correctly 95% of the time, independently. The chance that a request passes through all ten cleanly is 0.95¹⁰, about 60%. Roughly four in ten requests touch at least one step that went quietly wrong.
Not every slip becomes a wrong answer. Some are recovered by later steps and some do not matter. But none of them raise an error. As an illustration, at a million requests a day, if only one in ten of those slips reaches the user as a wrong answer, that is still 40,000 wrong answers a day, each indistinguishable from a correct one unless someone can trace the path that produced it.
Three signals, three questions
Observability rests on three kinds of signal, and each is incomplete on its own.
- Metrics show how the system behaves over time: rates, latencies, costs, error counts. They reveal trends but not the story of any single request.
- Traces follow one request through every step: each model call, retrieval and tool call, with timings and inputs. They tell the full story of one request but not the overall pattern.
- Logs record individual events in detail. They explain what happened at a specific moment but do not show trends.
Used together, they form a workflow for going from a symptom to a cause.
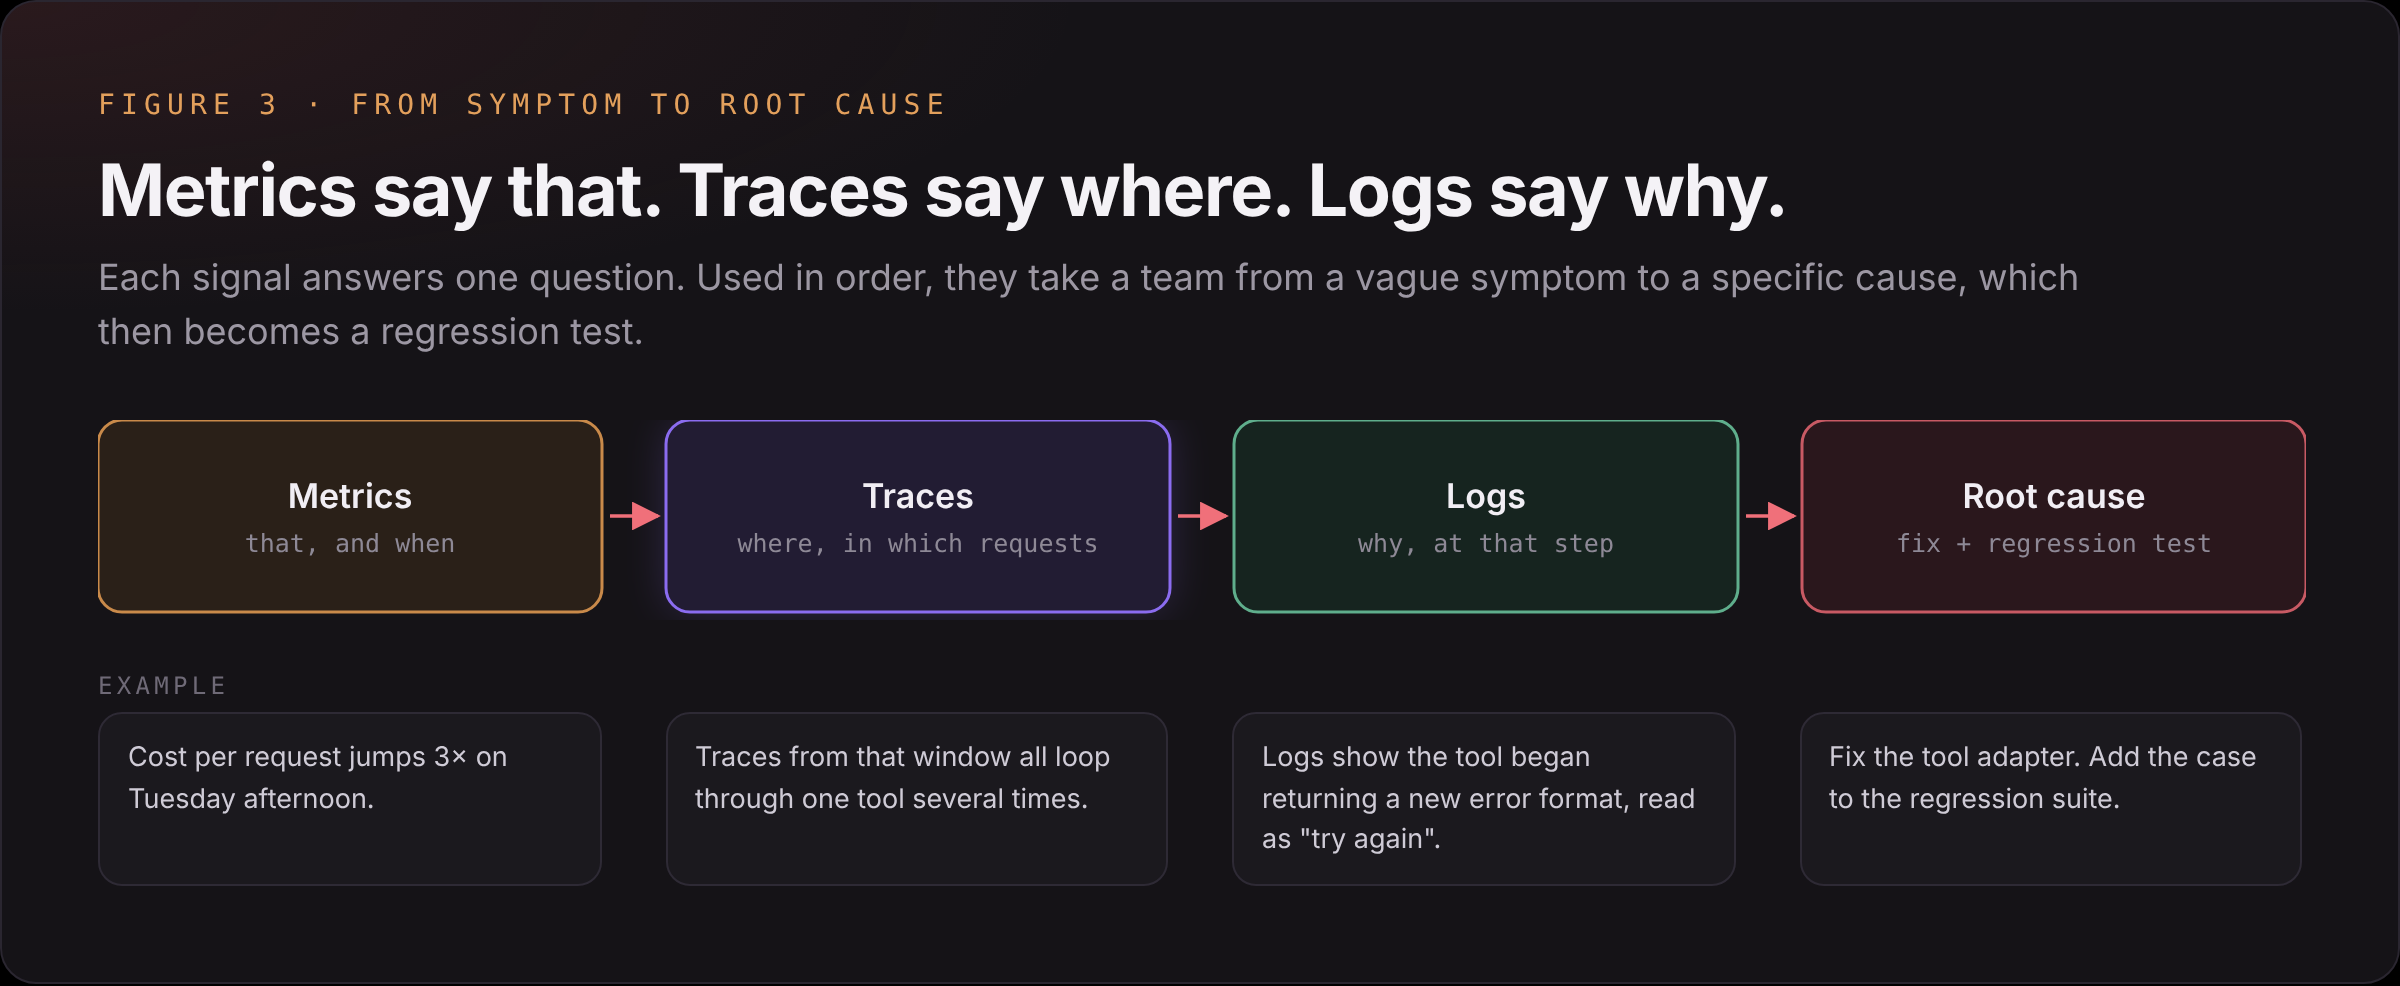
A metric shows that cost per request jumped on Tuesday afternoon. Filtering traces to that window shows the affected requests all looped through the same tool several times. The logs for those calls show the tool began returning a new error format after a deploy, which the agent read as "try again". The fix goes into the tool adapter, and the case goes into the regression suite.
For this to work, logs need to be structured: JSON with consistent fields such as session ID, request ID, tool name, error type and model version, so that a team can pull every event for one session where a given tool was called, instead of searching free text.
What to measure
Two established frameworks cover the basics. Brendan Gregg's USE method applies to resources: utilisation, saturation and errors. Tom Wilkie's RED method applies to services: rate, errors and duration.
Agents need more, because they consume resources that ordinary services do not:
- Tokens per request, input and output separately.
- Cost per request, which can vary by an order of magnitude between two requests that look alike.
- Tool calls per request, where a sudden rise often means a loop.
- Context-window utilisation, since a nearly full window degrades answers before it fails outright.
- Quality signals, such as online eval scores, user ratings and escalation rates.
These are the levers that drive both an agent's behaviour and its bill, and most generic monitoring stacks do not track them by default.
Where the signals come from
Agent telemetry comes from three layers, and each answers a different question.
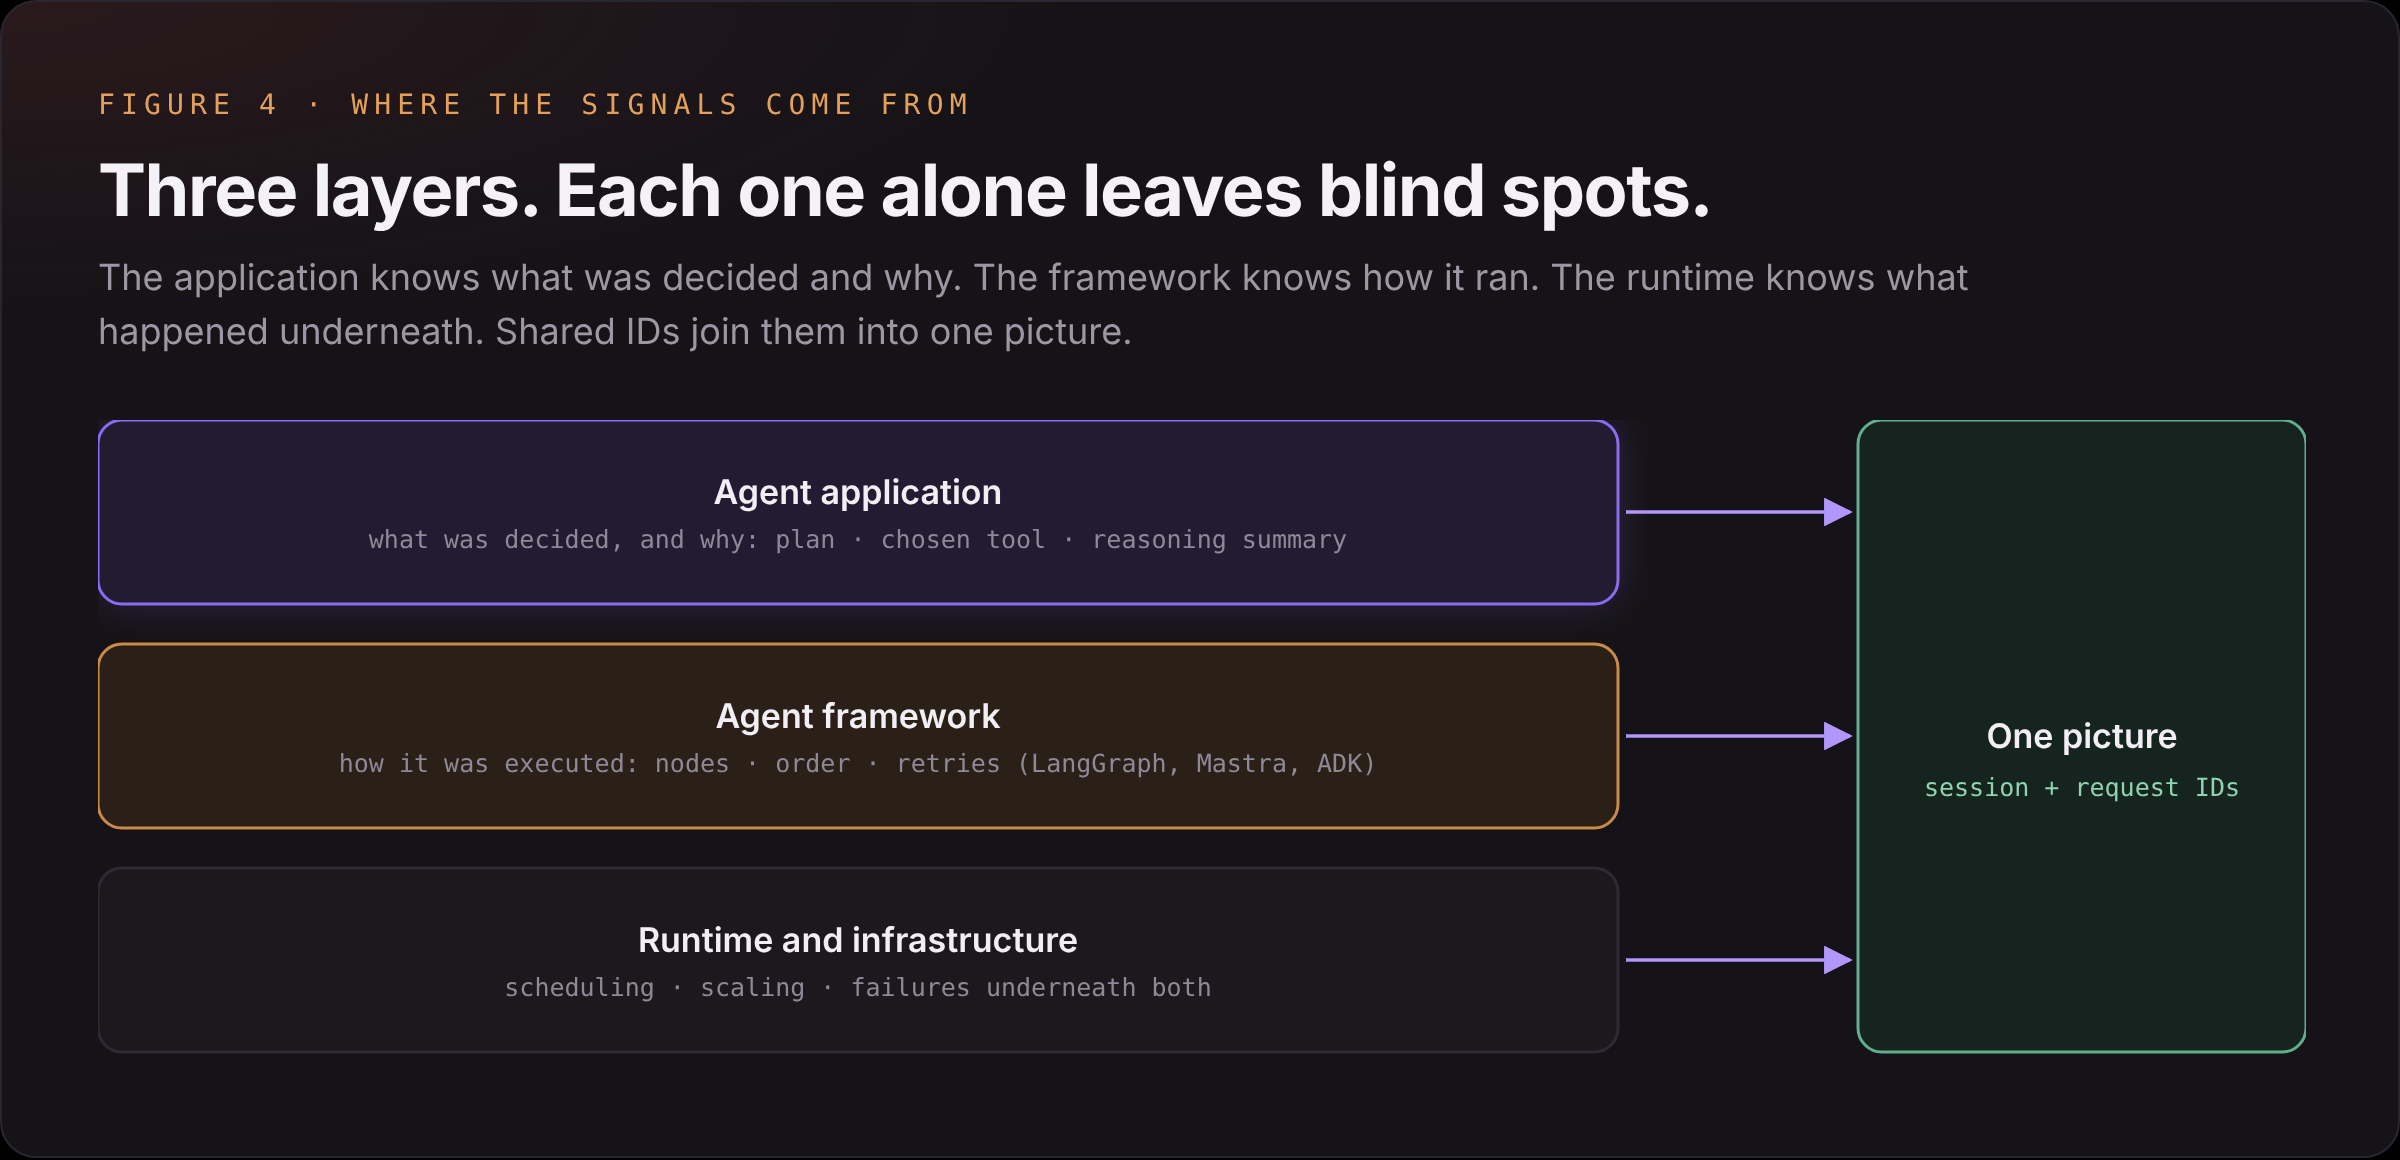
- The agent application records what was decided and why: the plan, the chosen tool, the reasoning summary.
- The agent framework, such as LangGraph, Mastra or Google's ADK, records how those decisions were executed: which nodes ran, in what order, with what retries.
- The runtime and infrastructure record scheduling, scaling and failures underneath both.
Instrumenting only one layer leaves blind spots. Framework traces alone will not say why a decision was made. Application logs alone will not reveal that a decision was delayed because a container was waiting to be scheduled. Every signal should carry the same session and request IDs, so that all three layers can be joined into one picture.
The pipeline behind it
Most production observability stacks have four parts. The application emits signals as tokens are consumed and tools are called. A collection layer filters, enriches, batches and exports them, tagging each with user, session and request IDs. Storage keeps logs, metrics and traces in systems suited to each, since they are queried differently and kept for different lengths of time. An analysis layer brings them into one interface, where a jump from a metric spike to a trace to a log line can actually happen.
Teams build this in one of four ways, each with a real trade-off:
- Self-managed: full control and no vendor lock-in, but the team owns availability and every upgrade.
- Commercial managed platforms: integrated and quick to start, but costly at scale and with pricing lock-in.
- Cloud-native services: low operational overhead within one cloud, with harder portability across clouds.
- Agent-specific platforms: treat tool calls and reasoning steps as first-class objects, where generic monitoring tools bolt agent concepts onto request tracing.
Evals in three modes
Evals that gate releases are covered in our guide to production GenAI systems. Around a live agent, they run in three modes.
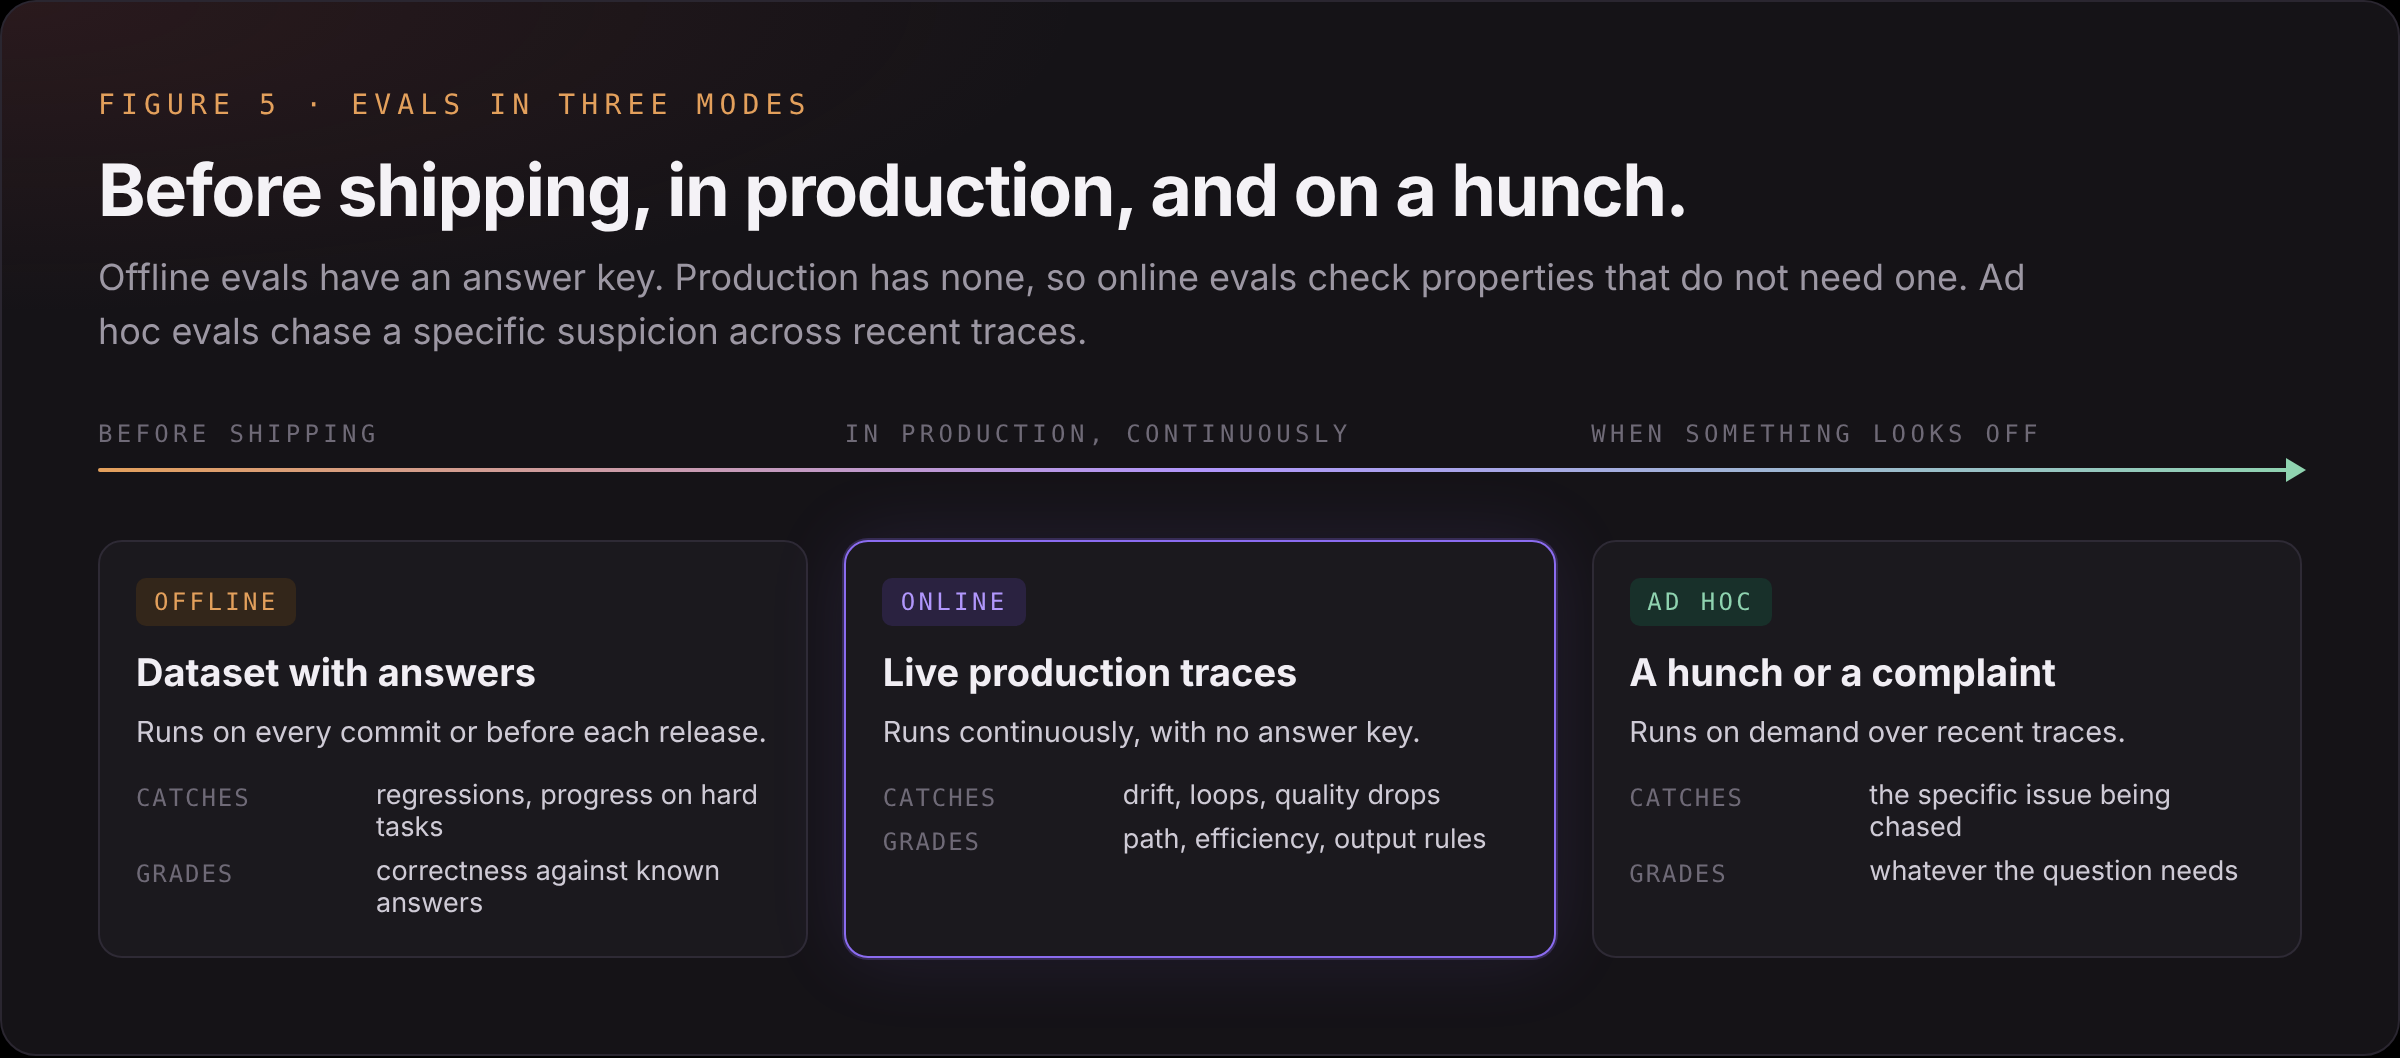
- Offline evals run against a dataset with known correct answers before a change ships, on every commit or before each release depending on cost. They catch regressions and track progress on hard tasks.
- Online evals run continuously over production traces. There is no answer key in production, so they check properties that do not need one: whether the agent's path was sensible, whether it was efficient, whether the output meets quality rules.
- Ad hoc evals are exploratory. A team runs them to chase a hunch or a specific user complaint across recent traces.
Online evals are where observability and evaluation meet. Traces are the data, and evals turn them into signals a team can alert on.
Standards are catching up
OpenTelemetry is the closest thing to a universal, vendor-neutral standard for telemetry. Its semantic conventions for generative AI now define spans for model calls, agent invocations and tool executions. As of 2026 they are still marked as in development, and attribute names can still change between releases.
OpenInference, maintained by Arize, is a separate set of conventions built on OpenTelemetry for LLM calls, retrieval steps, tool use and token accounting. Many tools support one or both.
Even with both, several gaps remain across the industry: clear cost attribution, quality signals that sit beside latency and errors, a single view across tools, and alerting that understands agent behaviour such as loops and drift. A capable platform needs to be agent-native, aware of cost and quality, ready for audit, and open.
Where observability stops
Observability tells a team what its systems recorded. Two questions sit beyond it.
Can the record be trusted? Logs and traces are written by the same systems they describe and stored where operators, or the agents themselves, can change them. When a record is used to settle a dispute, satisfy an auditor or investigate an incident, a team needs to show that nothing was edited after the fact.
What actually caused the action? A trace shows every input an agent saw before it acted. It does not show which of those inputs made it act. In a system with several agents passing messages, the input that was reached and the input that caused the decision are often different.
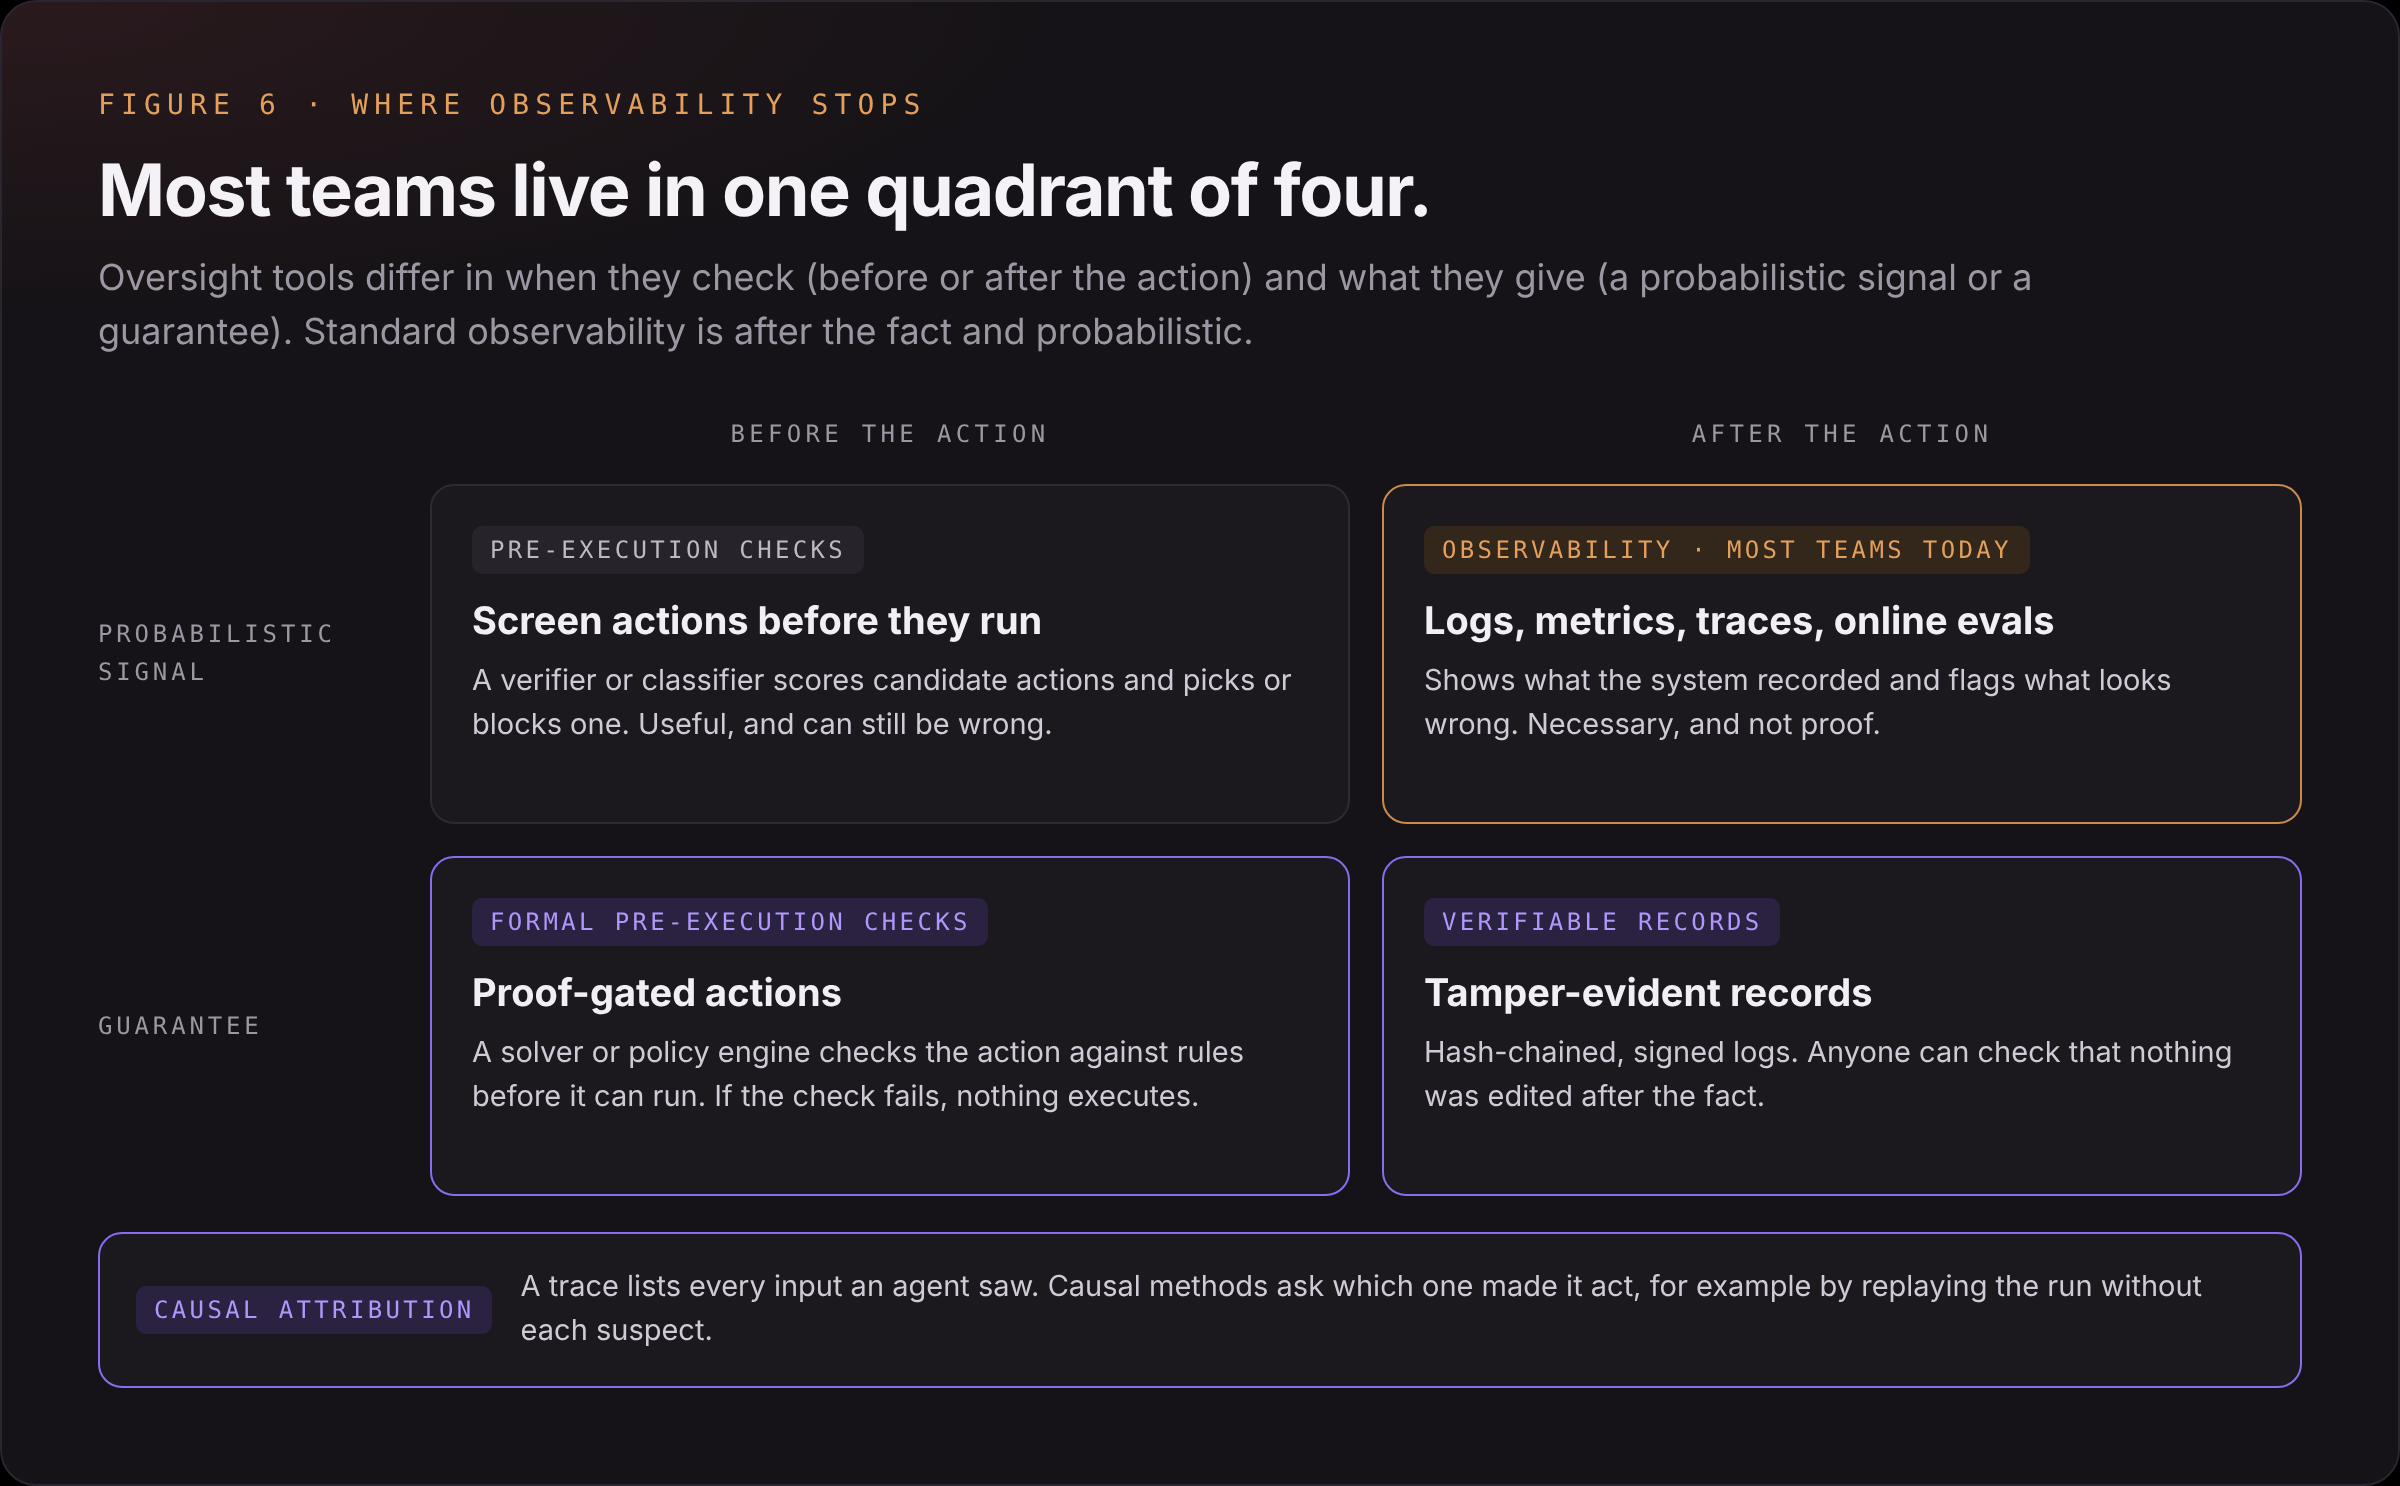
It helps to sort oversight tools by two questions: does the check happen before or after the action, and does it give a probabilistic signal or a guarantee? Standard observability sits after the action and is probabilistic. It is necessary, and on its own it is not enough for systems that move money, touch personal data or act without a human in the loop. The other quadrants, such as formal checks before an action runs and records that cannot be silently rewritten, are where much of the open work in agent oversight now sits.
Where to start
For a team running agents with little instrumentation today:
- Give every request a trace ID and carry it through every model call, tool call and log line.
- Switch to structured logs with consistent field names across services.
- Add agent metrics beside the usual ones: tokens, cost and tool calls per request, and context-window use.
- Adopt OpenTelemetry's GenAI conventions or OpenInference early, so traces stay portable while the standards settle.
- Run a few online evals on live traces, starting with checks that need no answer key, such as loop detection and output format.
- Turn every investigated incident into a regression test.
The takeaway
One wrong answer can come from four different places and look identical from the outside. Only a trace with the right attributes can tell a team which one it was. Instrument for that question first, and every other layer of oversight has something to stand on.
If you want to go deeper on observability for AI agents, the Observability for AI Agents course on MongoDB University is a good place to start. Cygnux Labs is not affiliated with MongoDB.